The platform, screen by screen
Your site already produces the data.
Plan-Sarthi turns it into control.
These are real screens from a live nuclear containment package — not mockups. One validated Daily Progress Report recomputes the S-curve, the critical path, earned value and the forecast completion date. Plan Smarter. Build Stronger. Deliver on Time.
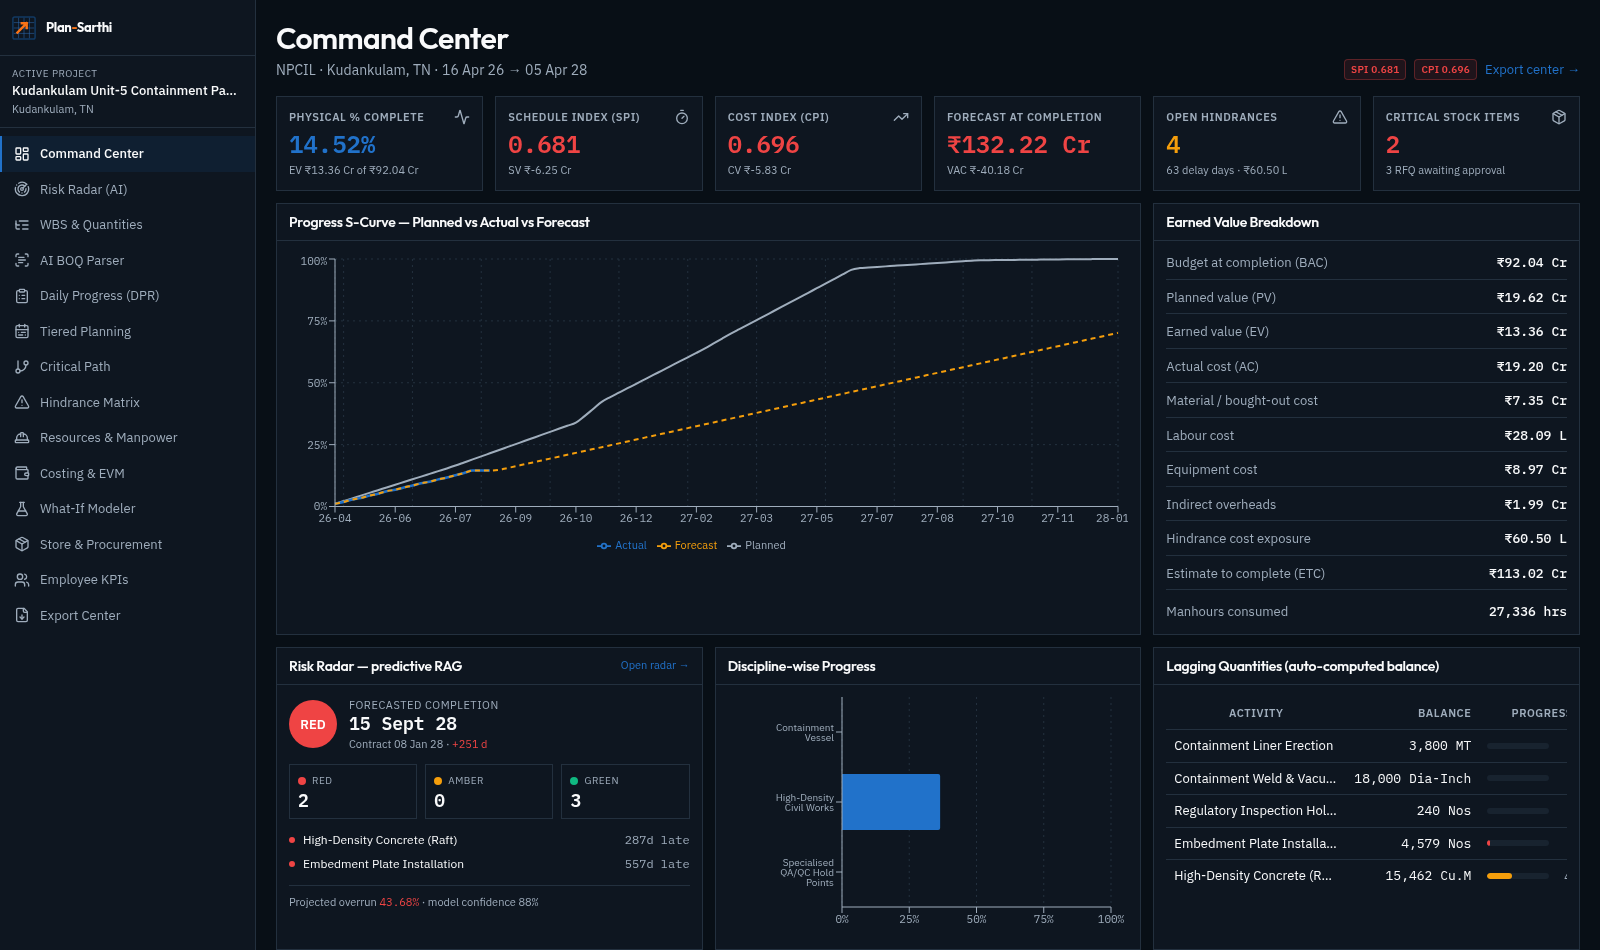
One screen your client review can run on
Physical progress, planned versus actual S-curve, CPI and SPI, cash-out curve and the day's manpower — all computed from validated field data, never from a percentage someone typed in. Open it on Monday morning and the meeting runs itself.
- —Live S-curve with baseline and forecast
- —CPI / SPI on physical progress
- —Red work fronts surfaced first
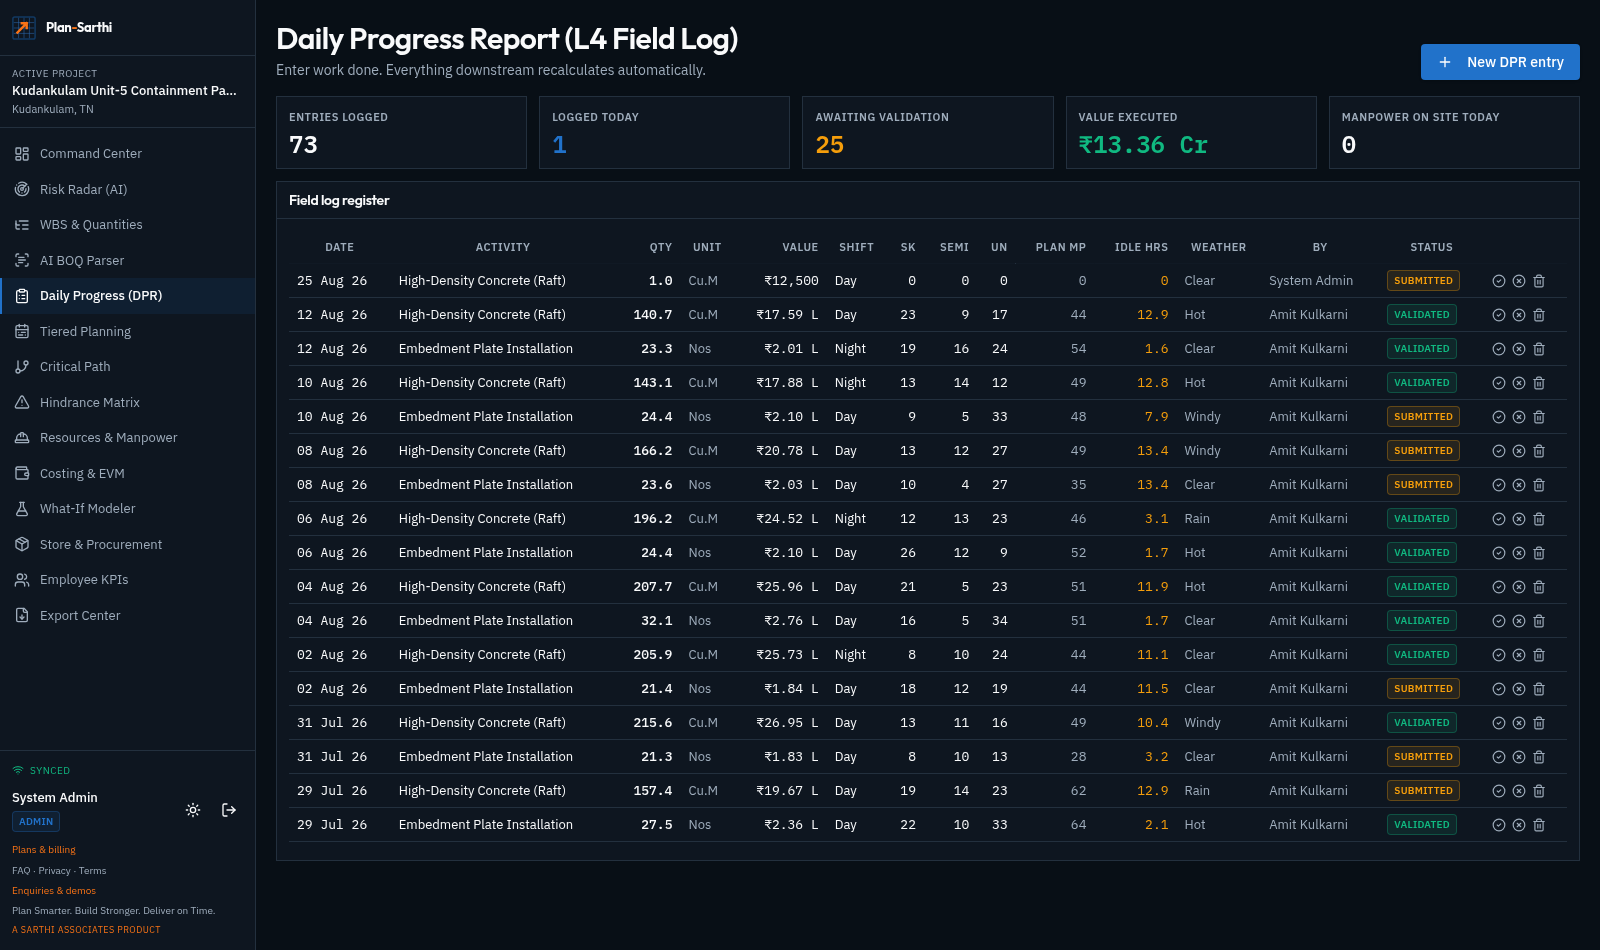
The field log that drives every other number
The site engineer records quantity executed, shift, skilled/semi/unskilled split, planned manpower, idle hours and weather. The moment it is validated, balance quantities, run-rates, the S-curve, earned value and the forecast completion date all recompute. Nobody reconciles anything by hand.
- —Quantity, manpower and idle-hour capture
- —Validation workflow before figures count
- —Works with no network signal and syncs later
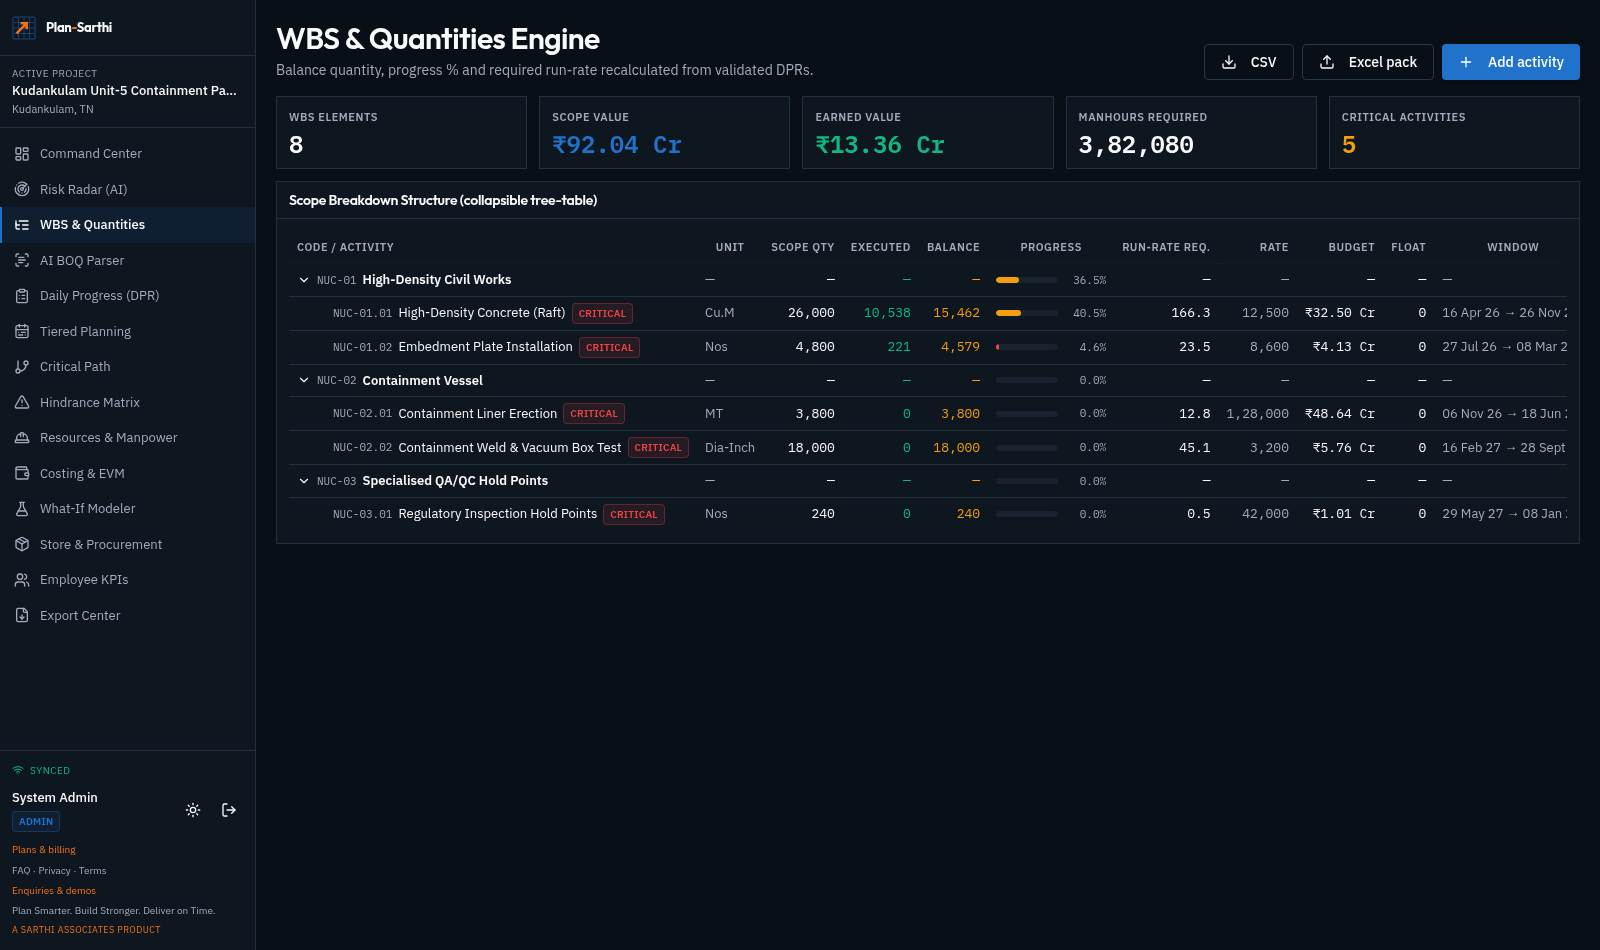
Scope in the units your contract actually uses
A three-level work breakdown with real quantities, units and rates — Cu.M of concrete, MT of structural steel, Dia-Inch of piping, Nos of plates. Balance quantity, executed value and progress are derived, not maintained.
- —L1 / L2 / L3 hierarchy with codes
- —Discipline-wise rollups
- —Balance quantity computed automatically
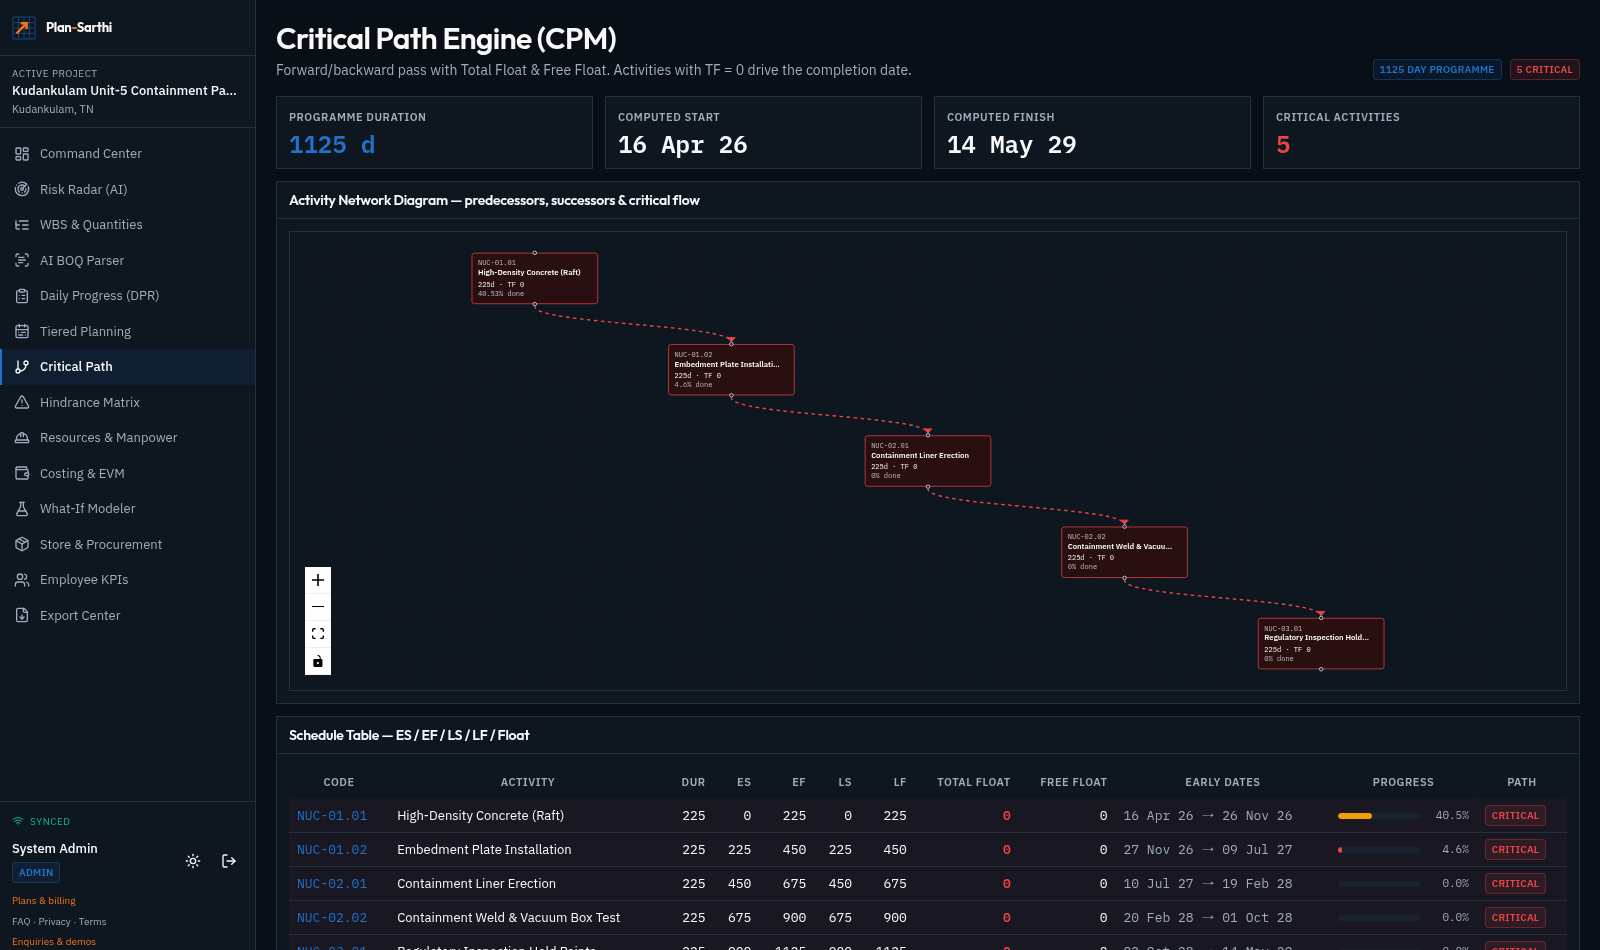
Float you can defend in a claim
A full forward and backward pass gives early and late dates, total and free float, and marks the activities driving your completion date. The network diagram shows the logic; the schedule table gives the numbers an extension-of-time notice needs.
- —ES / EF / LS / LF and float per activity
- —Interactive activity network diagram
- —Critical chain highlighted end to end
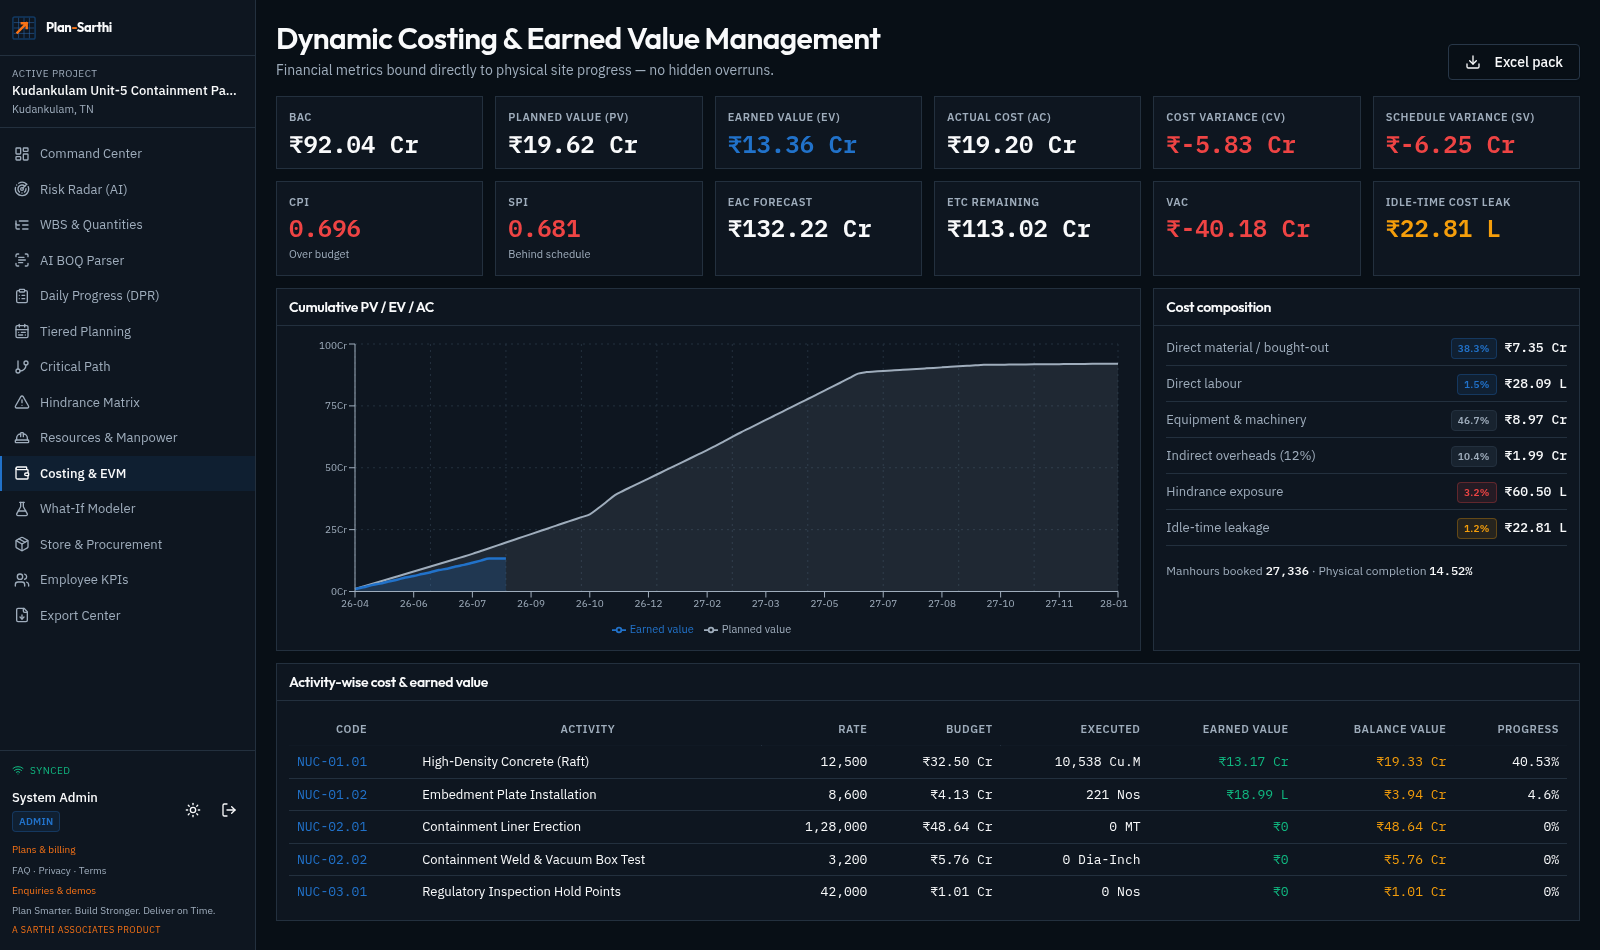
Earned value tied to physical progress
BAC, PV, EV, AC, cost and schedule variance, CPI, SPI, EAC and VAC — plus the two leaks most contractors never price: idle-time cost and hindrance exposure. You see an overrun forming while there is still time to act on it.
- —Full EVM set on real executed quantity
- —Cost composition with overhead loading
- —Idle-time and hindrance cost leakage
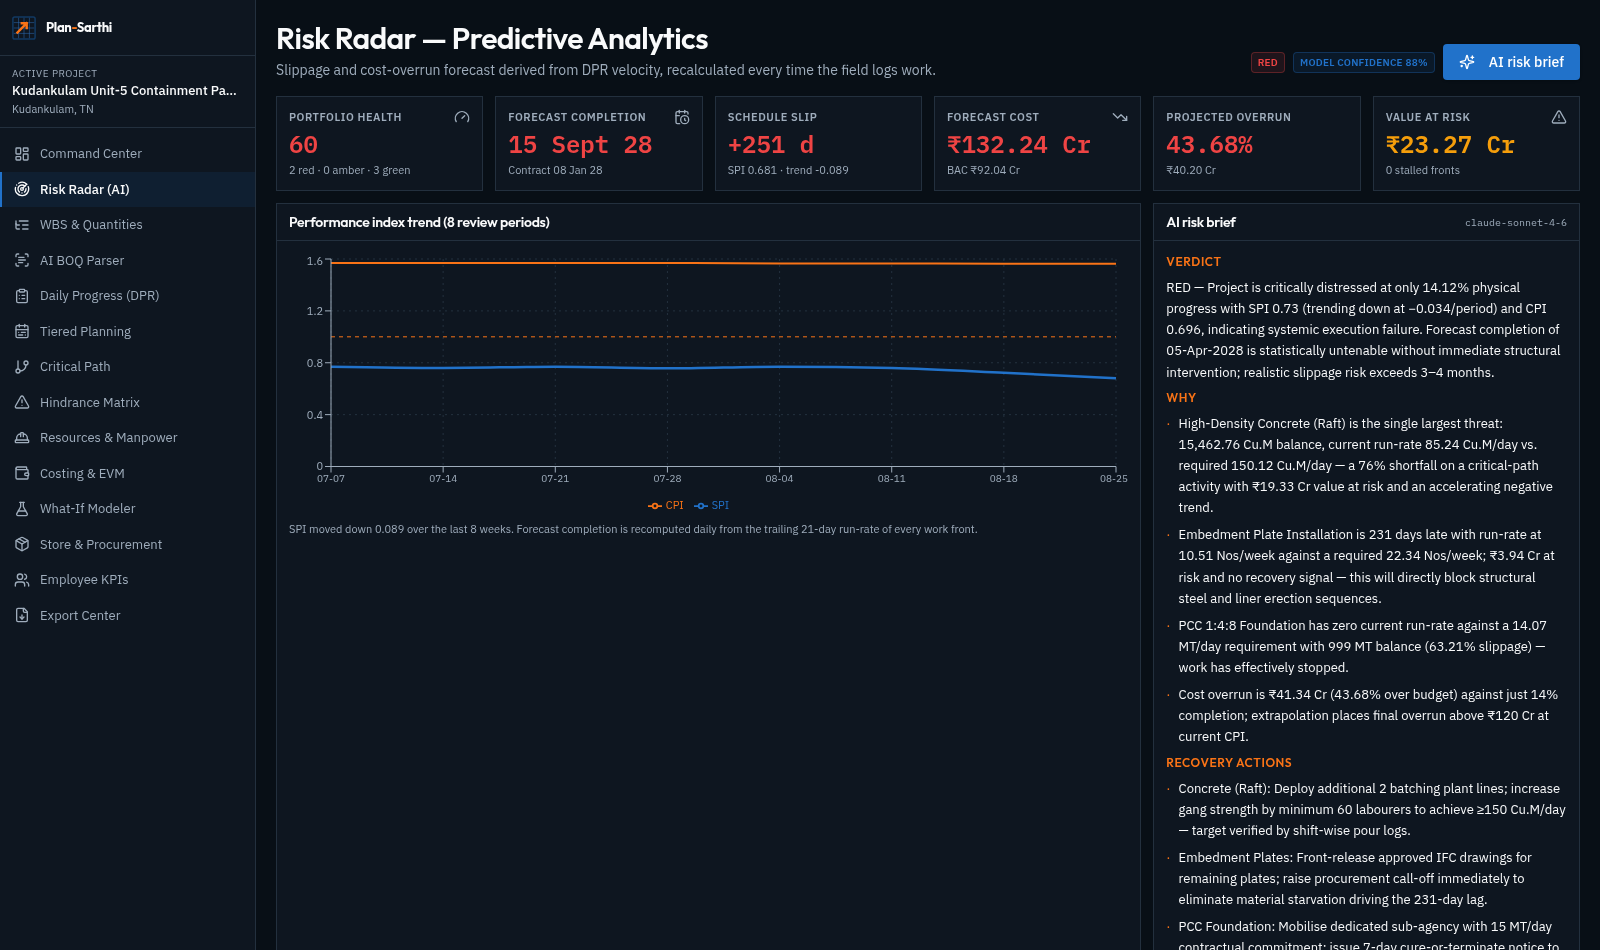
The delay, called weeks before it lands
Every front's trailing 21-day run-rate is compared with what the remaining scope demands. Fronts are banded red, amber or green, each with a forecast finish and days-late figure, and the AI writes the management brief: verdict, causes and specific recovery actions.
- —Forecast completion and projected overrun
- —Value at risk per work front
- —AI verdict with recovery actions
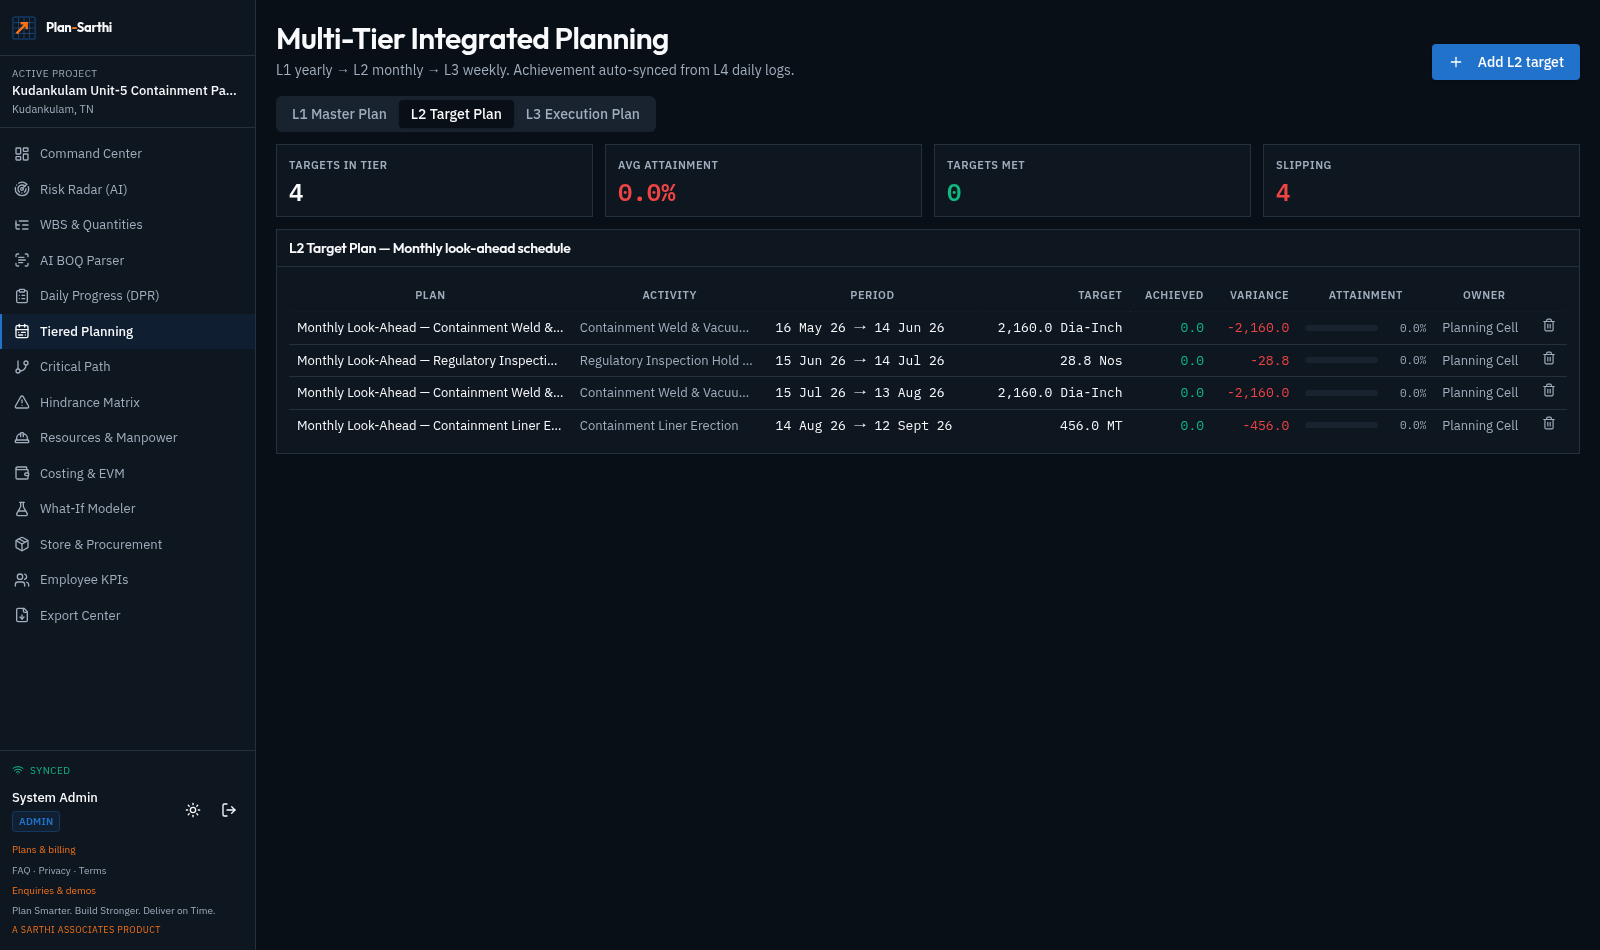
Yearly intent, broken down to this week's target
L1 annual targets cascade into monthly and weekly commitments per work front, and achievement is measured against the DPR — so a slipping week is visible on the Friday, not at the month-end review.
- —L1 / L2 / L3 target cascade
- —Weekly achievement versus commitment
- —Resource and manpower planning
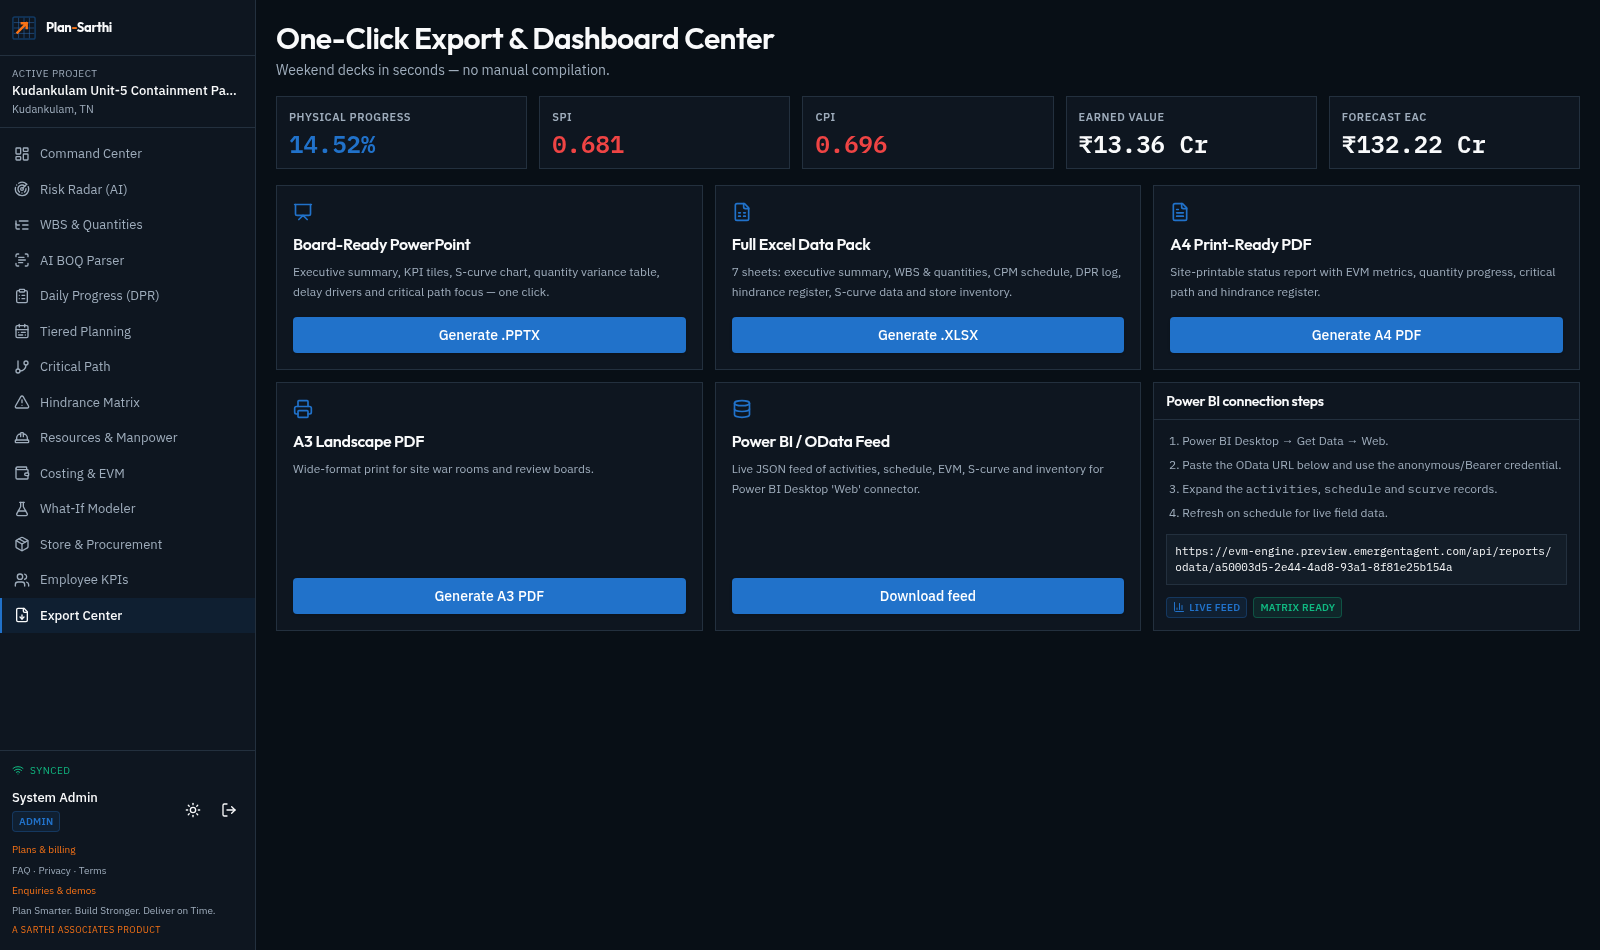
The reporting pack, in one click
A seven-sheet Excel data pack, a board-ready PowerPoint deck, A4 and A3 print PDFs, and a live Power BI feed — generated from the same validated data, so no two reports ever disagree.
- —Excel, PPTX and print-ready PDF
- —Power BI / OData live feed
- —Same numbers everywhere
Built for site reality
Works with no signal
Site engineers log DPRs in zero-connectivity zones; entries sit on the device and sync themselves the moment a bar of signal returns.
AI BOQ Parser
Drop in an Excel, CSV or PDF BOQ. Two engines extract it, units are normalised, confidence is scored per row — you review and confirm, and it becomes a live WBS.
Store & procurement
Material inward, issue, consumption against activity and reorder levels, so a stock-out shows up as a schedule risk instead of a surprise.
Employee KPIs
Output per engineer per work front, so performance conversations are based on executed quantity rather than impressions.